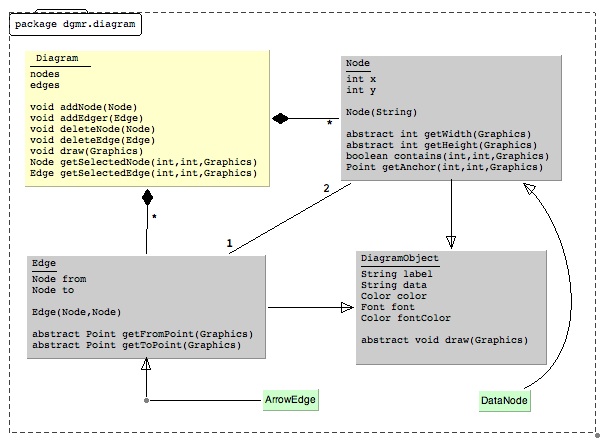
Figure 1. Diagram objects
The diagrams considered are finite graphs whose nodes and edges have a finite number of properties. Computational logic can specify diagrams and reason about them. The visual appearance of such a diagram is expressed using factual logic. Factual logic describes the factual appearance of a particular diagram. General properties of diagram objects and higher-order relationships between them are represented in generic logic. Generic logic describes the general meanings that one intends certain kinds of diagrams to have. Some examples are given to motivate this approach, including some executable Prolog code. A definition for the sameness of meaning of two diagrams is also discussed briefly.
π : O × K --> VThis property function assigns a value to (object,key) pairs. In practice, this may be a partial function (not defined for all pairs). For example, the "color of edge e is red" might be represented as π(e,color) = red. Generally speaking, the equation
π(o,k) = vmeans that the diagram object o has property value v for key k. Keys and values specify visual attributes of the objects appearing in diagrams.
Let us call these diagrams structure diagrams. Structure diagrams can be used to represent most of the salient features of many kinds of diagrams, including class diagrams, finite state diagrams, flow charts, lattice diagrams, decorated trees, decorated graphs, proof diagrams and proof trees, and others. However, the definition probably cannot adequately represent others kinds of diagrams, like Venn diagrams or Euler diagrams.
The diagram in Figure 1 shows an object-oriented class diagram depicting relationships between diagrams, nodes and edges. If one is familiar with this kind of diagram, then its intended meaning is probably quite clear. It is a class diagram characterizing diagrams. This particular diagram intends to say that a diagram in general has nodes and edges; nodes and edges are kinds of diagram objects that can have labels, colors, fonts, font colors which can draw themselves in a graphics context. Nodes have a location x and y and a calculated width and height. Edges connect two nodes. In addition there are particular kinds of nodes and edges, like oval nodes or line edges, for example. In addition, the classes defining all of these various objects belong to a package called 'dgmr.diagram'.
It is possible to use many kinds of attributes (like color, shape, font, etc.) to indicate some meaning in a diagram. For example, the abstract classes in the diagram are shaded gray to distinguish them from classes that can be instantiated. Most OO modeling diagrams would have represented this relationship with an <<abstract>> tag.
Figure 1 represents a design artifact for a software system \cite{Diagram} that was used by the author to actually draw the diagram. The diagram is a useful working example for the following sections.
     node(+Node)
     edge(+Edge,+FromNode,+ToNode)
     property(+Object,+Key,+Value)
The first form expresses that node belongs to, or is part of the diagram.
The second form
expresses that edge connects from node1 to node2.
The third form expresses that an object
(node or edge) has a property value for a particular key.
Such a framework is a kind of
semantic network.
Given an intended factual framework, the appearances of diagrams are translated into factual clauses. Most interesting are automatic translations to logic using software that can inspect the diagram objects. For example, the software that drew the previous diagram has a subsystem that generates factual logic code. (See the link thereto at the end of this section.) That software (written in Java) produces code similar to the following sample code. This sample code expresses some of the facts about the previous diagram. The abundant actual code produced (file diagram.pl) is shown reformatted (and simplified) for display here, and a very large part of it was omitted.
   % nodes
   node(node_0) .
     ...
   % edges
   edge(edge_0,node_1,node_2).
     ...
   % property key = label
   property(node_0,label,'Diagram').
     ...
   % property key = type
   property(node_0,type,'dgmr.diagram.DataNode').
     ...
   % property key = color
   property(node_0,color,[255,255,255]).
     ...
   % property key = position
   property(node_0,position,[38,55]).
The logic code generator used the values of object instance variables and the concept of
Java introspection to generate the factual logic.
If the diagrams have more generalized content, like images, then the values of certain keys would need to be links to that content, or some other descriptor.
What kind of logical specification is reasonable to use? In this section we use code that can be computed as-is with Prolog, or can be loaded into a Prolog logic meta- interpreter. Other, similar, formulations might be appropriate to use with specialized Prolog logic meta-interpreters.
For a specific example, consider the concept of inheritance in an object-oriented class hierarchy diagram. The usual kind of rule for depicting this relationship diagrammatically is to draw a certain kind of terminal edge (usually some kind of open arrowhead) from the child class to the parent class (with intermediate line links from the child class allowed). This general convention applies then to all hierarchy diagrams. Here is some sample code (file extends.pl) to compute the inheritance relationship. This generic rule base is suitable for combining with the factual rules having the given predicate formats.
   %% class S extends class P
    extends(S,P) :-
       node(NS),
       classNode(NS),
       property(NS,'label',S),
       node(NP),
       classNode(NP),
      property(NP,'label',P),
      connectedByArrow(NS,NP).
   %% class S extends class P, Nth removed
   extends(S,P,1) :-
      extends(S,P).
   extends(S,P,N) :-
      extends(S,M),
      extends(M,P,N1),
      N is N1+1.
   %% Is there an "extends" edge between X and Y?
   connectedByArrow(X,Y) :-
      edge(E,X,Y),
      closedArrow(E).
   connectedByArrow(X,Y) :-
      edge(E,X,C),
      property(C,'type','dgmr.diagram.ConnectorNode'),
      lineEdge(E),
      connectedByArrow(C,Y).
   %% Definition of "closed arrow" edge
   closedArrow(E) :-
      ( property(E,'type','dgmr.diagram.ArrowEdge') |
         property(E,'type','dgmr.diagram.CubicEdge') ),
      property(E,'tip','closed_tip').
   %% Definition of "line" edge
   lineEdge(E) :-
      ( property(E,'type','dgmr.diagram.ArrowEdge') |
          property(E,'type','dgmr.diagram.CubicEdge') ),
      property(E,'tip','no_tip').
   %% Definition of "class" node
   classNode(N) :-
      property(N,'type','dgmr.diagram.DataNode') |
      property(N,'type','dgmr.diagram.RectNode').
If the factual logic (file diagram.pl generated for the diagram
in Figure 1) and this generic
rulebase (file extends.pl) are both loaded into the same Prolog context,
then the following shows answers
extracted by Prolog.
The answers produced indicate first inheritance relations once removed (X inherits from Y directly) and then inheritance relations twice removed (X inherits from some W which in turn inherits from Y), and so on.?- [diagram,extends]. % load these two files % diagram compiled 0.00 sec, 20,760 bytes % extends compiled 0.00 sec, 2,200 bytes ?- extends(X,Y). % DIRECT EXTENSION X = 'Edge' Y = 'DiagramObject' ; X = 'Node' Y = 'DiagramObject' ; X = 'ArrowEdge' Y = 'Edge' ; X = 'DataNode' Y = 'Node' ; No ?- extends(X,Y,N). % DIRECT or INDIRECT EXTENSION X = 'Edge' Y = 'DiagramObject' N = 1 ; X = 'Node' Y = 'DiagramObject' N = 1 ; X = 'ArrowEdge' Y = 'Edge' N = 1 ; X = 'DataNode' Y = 'Node' N = 1 ; X = 'ArrowEdge' Y = 'DiagramObject' N = 2 ; X = 'DataNode' Y = 'DiagramObject' N = 2 ; No ?-
Notice that extends(-,-,-) could be used to compute an object oriented software metric: The "inheritance diameter" of a system, which is the longest inheritance path for any object in the system (how removed inheritance could be). This modification is an exercise for the reader.
Exercise 8.5.1. Implement this inheritance diameter metric.
The current example, inheritance, is a little more complicated than the casual reader may at first appreciate. The presentation up to this point depends upon the not unreasonable assumption that the human diagram creator has drawn line edges in the direction of an inheritance arrow. For example, the line edge in Figure 1 was drawn from the node labelled "ArrowEdge" to the little round connector node (and not in the reverses direction. Were it the case that this line edge had been drawn in the opposite direction, no one could see the difference visually. The diagram would have exactly the same appearance. But the factual logic would not have sufficient information to produce a conclusion of inheritance (X = 'ArrowEdge', Y = 'DiagramObject'). If our intention was to allow the connecting line edges to have been drawn in either direction then, we could not use a simple Prolog program to interpret our fact base (unfortunately!).
Exercise 8.5.2. Show how to modify extends.pl so that the line edges to the connector nodes could be drawn in either direction. (Hint: only one line needs change.)
Some intensions can be deduced from the overall edgewise connectedness of nodes, like the inheritance example just given. Other intensions might use other facts from the factual rulebase. For example, "belonging to the package" in the previous diagram could be computed using the actual positions of the nodes (where they are located in the view), relative to the visual "package corral". Still other intensions can be based upon the textual (or other) content associated with a node, such as the fields, constructors or methods of a class node, or with constraint notes attached to the same items. We do believe that resolution logic using definite clauses should suffice for much of specification logic. However, care is needed to write these Prolog specifications so as to avoid cyclic graph definitions that would cause infinite recursion during queries.
Exercise 8.5.3 (Big Project) Design and implement a prolog program that is able to analyze a website and creates a diagram for its contents. Design generic logic for analyzing the contents of a website via analysis of its diagram, and build the query engine for this. This is a kind of expert system for the semantic web.
Assume that the factual rulebase F consists of unit clauses (as described previously) and that the generic rulebase G is a datalog program (positive definite clauses, no negation, and no built-in predicates like sequences or lists). The meaning of the diagram corresponding to facts F and generic rules G is defined to be the minimal model of the combined rulebases F ∪ G.
Suppose that GF is the set of all instances of rules in G which have been grounded using terms generated by the constants and function symbols from F. The minimal model M can be defined inductively as follows.
M0 = EM0 contains just the facts E. For k > 0 define
Mk = { A | A :- B1,...,Bn in GF, Bi in Mk-1, for all i} ∪ Mk-1Each Mk contains all derived consequences using rules in G and derived consequences from Mj, for j < k.
Finally,
M = M(F ∪ G) = ∪ Mk
Note again that this minimal model always contains the factual rulebase.
Using a common generic rulebase G, two diagams D1 and D2 have the same intended meaning provided
M(F1 ∪ G) \ F1 = M(F2 ∪ G) \ F2
where F1 is the extensional rule base determined by D1 and F2 is the extensional rule base determined by D2 (and where "\" denotes set difference). Intuitively speaking: the two diagrams have the same intended meaning provided they have the same consequences, even though they may have somewhat different (factual) appearances.
For example, in the previous inheritance example, it is clear that the meaning of the diagram should not change if some of the nodes were moved a little. We say "a little" because we could easily make a scramble of the visual appearance and thus lose visual impact, let alone intuitive meaning. Of course, if G were to depend fairly strictly on position then nodes could not be moved very much before the intended meaning of the diagram would change.
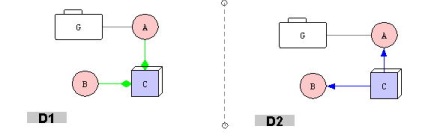
For the following example, consult Figure 2. Suppose that in a certain kind of diagram some intensions (rules) are specified in G1 for diamond edges which are green. Suppose that we consider all other intensions to be the same but that now blue solid arrow edges are used everywhere to specify what was previously meant for green diamond edges, giving new intensions G2. Suppose further that diagrams D1 and D2 are the same except that wherever D1 has green diamond edges, D2 has blue solid arrow edges. Then it makes sense to say that D1 and D2 have the same meaning.
A mathematical characterization is as follows. Suppose that D1 and D2 are diagrams having generic rules G1 and G2 and suppose that there is a one-to-one analogy function
α : G1 --> G2which maps node specs to corresponding node specs, edge specs to corresponding edge specs, and property specs to corresponding property specs. Then we say that the analogy a assigns the same meaning to D1 and D2 provided
M(α(F1) ∪ G2) \ α(F1) = M(F2 ∪ G2) \ F2Exercise 8.5.4 Earlier in this section we gave an alternate graphical metaphor for abstract classes. We said that a class node with a gray color could be used to mean that the class was an abstract class. We said that an alternate way to represent abstract classes was to use an <<abstract>> label somewhere in the diagrammatic specification (e.g., UML). How do the definitions in this subsection cover this particular concept? What is the analogy function?
Exercise 8.5.5 (Project) Implement analogy functions in a general way so that diagrams can be computed as having the same meaning.
This brief discussion has avoided many technical details. The concepts seem very theoretical, but could be of considerable practical importance.
In addition, if G is not a simple datalog logic program, then one must define meaning in terms of some other logic program semantics. For example, if I contains rules with negation (intended to be computed as negation-as-failure) then we could use some kind of so-called closed-world semantics. See reference Lloyd(1984, 1987) again. This semantics is nonmonotonic, which in the current context of diagrams means that some conclusions about diagrams could be blocked by adding new nodes, edges or properties. For example, suppose that we had a rule that said that a certain conclusion holds as long as some involved node is not blue. If that conclusion holds for a certain diagram and then we change the color of the crucial node to blue, then the conclusion becomes false. That never happens for positive definite logic. Other logics (say the possibility of facts with explicit classical negation and rules containing same) would require other appropriate semantics.
There may be better logics for computing consequences of diagrams.
diagram.pl
extends.pl
Diagram WebSite
Click on ... Diagram Info > Extensions > User-Defined Code Generator