
Brief Introduction
to
Visual Logic
John R. Fisher
Luu Tran
10/12/95 (2/2/96, last modified 6/20/96)© JRFisher

For illustration, consider the logic of the following paragraph. The example is hypothetical. It concerns certain assumptions regarding relevant factors about guilt or innocence in a criminal trial. The example is supposed to compare various ways of presenting logical information, and to show some of the advantages of a visual approach.
First, we have a textual characterization of information.
The defendant is guilty provided that motive, opportunity, and incriminating forensic evidence can be established. Either jealousy and anger or else possessiveness and anger provide a motive and testimony confirms that the defendant was indeed angry, and either jealous or possessive. Opportunity can be established by showing that the defendant was nearby. There is evidence that the defendant was nearby during the crime. Opportunity is contravened by a reliable alibi, such as being observed somewhere else at the time of the crime. The defendant has a witness to her being elsewhere at the time of the crime. Fingerprints are a conventional form or forensic evidence, and the defendant's fingerprints are present on the murder weapon.
Second, but without much explanation, we give a formal logic representation using a typical kind of notation. Even if the reader has not specifically seen this before, it should be possible to see connections between the following notations and the foregoing prose.
motive & opportunity & forensic_evidence --> guilty
anger & jealous --> motive
anger & possessive --> motive
anger
jealous or possessive
nearby --> opportunity
nearby
alibi --> ~ opportunity
observed_elsewhere --> alibi
observed_elsewhere
finger_prints_match --> forensic_evidence
finger_prints_match
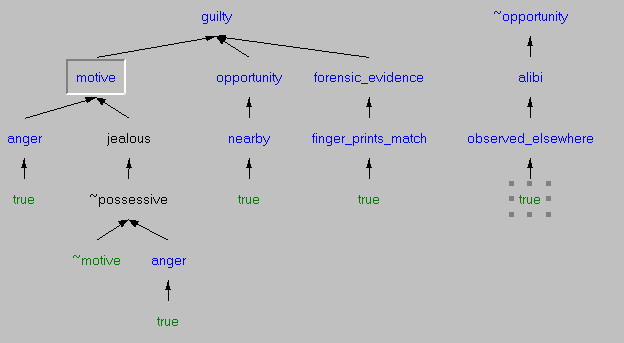
The display above resulted for a visual logic system used in an "explore mode". This mode explores the logical consequences of the data that it has. The answers are given in the form of trees showing visually how conclusions are supported by the evidence. These question-answering facilities in the explore mode are interactive. In the explore mode, the user might start by creating the top node for a query, and then make a choice for how to expand a tree under the top node. Here is a graphical representation showing how this looks for one of the current systems...
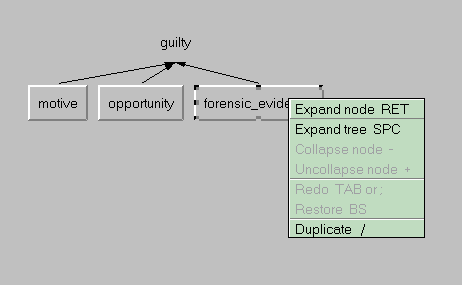
Figure 2 actually represents an earlier look at the tree in Figure 1, before it was completed to the "true" leaves. The explore mode may allow many choices to the user. In particular, nodes displayed in relief, if selected, may be "re-expanded" using other information, or rules of inference. For example, in Figure 1, the "motive" node could be selected for re-expansion according to the other logical rule involving "motive". Selecting can be done with the mouse or using arrow keys. Figures 3 and 4 show how that would look ...
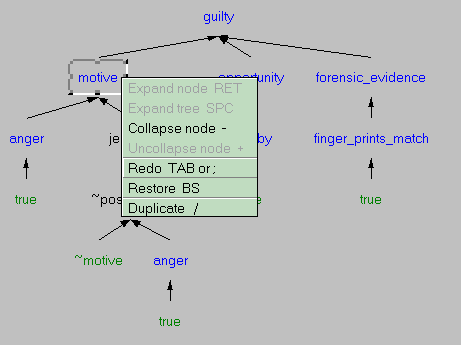
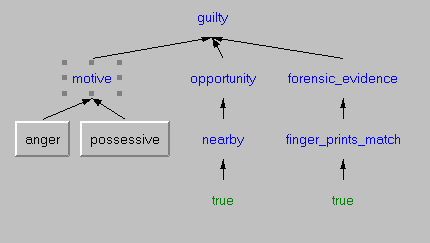
The visual presentation of logical information can be enhanced using color. In Figure 2, before conclusions have been verified, the nodes of the tree are displayed in some neutral color. In Figure 1, after conclusions have actually been reached, the blue color represents conclusions that are in evidence. In Figure 4, after "redoing" a node in Figure 3, some of the colors return to neutral, indicating that potential further inferences need to be made. Different colors are used to represent different kinds of information about consequences, as subsequent examples will show.
The astute reader will have noticed that the logical data for the example has conflicts, or contradiction, in it. The conflict is actually quite apparent if one looks at the trees in the Figure 1, since the author chose to expand trees that expose the contradiction. The conclusion of "guilt" is obviously not well supported, even though there is a kind of completed evidence in its favor. The problem is that "opportunity" is conflicted, and the visual diagrams clearly show this. Perhaps the main advantage to the visual approach is illustrated by this simple kind of example. A visual logic system may or may not allow logical contradictions. If it does -- and we have a system specifically designed to illuminate conflict -- then the visual logic must find a way to present the conflict in a revealing and decisive manner. In the "query" mode of the current visual tool (being developed by Luu Tran) inference trees exposing logical conflict can be generated automatically. Figure 5 shows this, using the current example ...
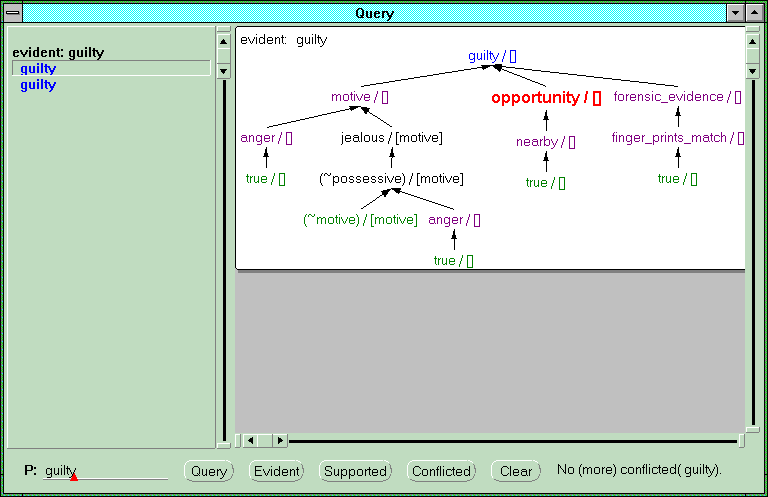
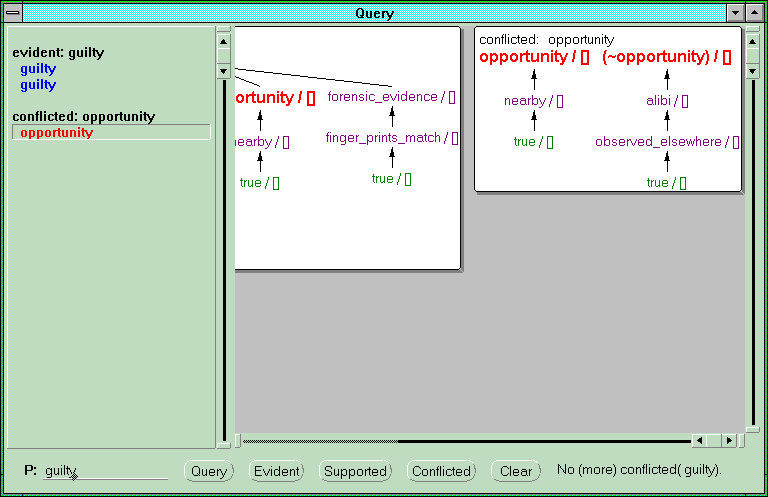
Figure 5 represents a screen snapshot in "query" mode. The VL tool automatically queries the logical database to deduce "evident" propositions (in blue on the left). The user then clicks on a generated conclusion, and the tool shows the result of its search for support. In this case the reasoning engine has deduced the conflict, which is shown in red in the diagram drawn on the right portion of the screen. If the user subsequently clicks on a red, or conflicted, node the tool will display the inference tree for its contrary (~opportunity in this case). This result is illustrated in Figure 6.
The third reference provides a new mathematical theory for declarative conflict upon which the current visual logic system is based. Even though the theory is based upon concepts familiar to (exacting) intuition and (informed) common sense, the difficulty of the formal theory motivated the desire of the authors to explore some appropriate methods of visualization.
The theory and the visual tool (VL) both allow rules with logical variables. For example, consider the following set of rules, written in the actual input form currently used ...
grandparent(X,Y) <- parent(X,Z), parent(Z,Y) .
parent(tom, alice) <- true .
parent(tom, bill) <- true .
parent(alice, jane) <- true .
parent(alice, john) <- true .
Figure 7 explores some of the possibliities, produced by the visual tool ...
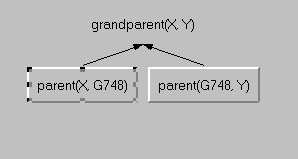
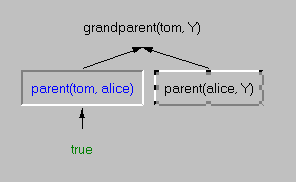
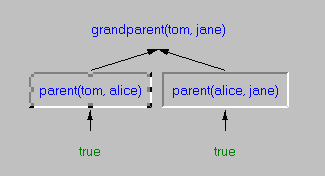
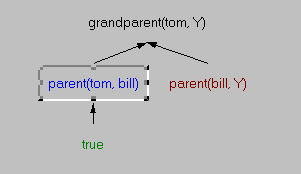
In (a), node "grandparent(X,Y)" is expanded one level and the left child selected. In (b), the left child is expanded. Notice how variable bindings are communicated to relevant parts of the tree. In (c), the right node selected in (b) is expanded, producing an inference tree showing that grandparent(tom, jane) is evident. In (d) the selected node in (c) is "redone" using other information. Notice that this forces variable bindings so that the rightmost leaf "parent(bill,Y)" cannot be satisfied, and this is indicated using the light red coloring on the node.
The intention is to also make the visual logic tool adequate as an interactive Prolog debugging and visualization tool.
A visual logic system may also allow the user to enter the information in a tree format, similar to formats previously displayed, using graphical tools such as text boxes (user types in information) and line drawing tools. This is a form of visual programming: The visual logic system builds an internal representation for this information that is sufficient for further logical analysis. In the graphical input, related information need not all be connected together to form larger trees, as was done in this simple example, but could be given by the user in a piecemeal fashion -- say, one rule at a time.
[1] Fisher, John R., Semantic trees for disjunctive logic programs, Proc.
Third Golden West International Conference, ed. E.A. Yfantis, Kluwer
Academic Publishers, 1995, pp. 291-305.
[2] Fisher, John R., Tree-based semantics for logic programs with negation
as failure, The Journal of Interdisciplinary Studies, California
State Polytechnic University, Fall 1994, pp. 107-116.
[3] Fisher, John R, and Tran, Luu, A visual logic, Proc. 1996 ACM
Symposium on Applied Computing (SAC96), Philadelphia, Penn., pp. 17-21.
[4] Tran, Luu, Visual Logic, A Visual Logic, Masters
Thesis, California State Polytechnic University, 1996.