SHOW SPREADSHEET IN SEPARATE WINDOW ↬
Download the Numbers spreadsheet modDR.numbers.
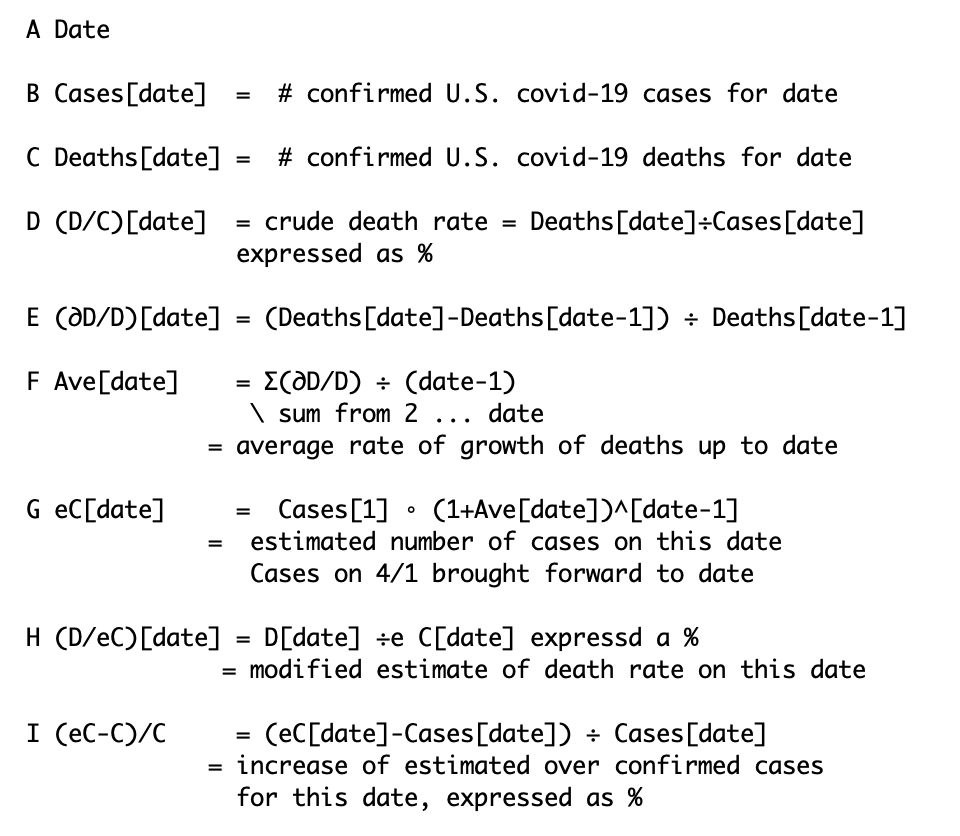
Daily CDC data was transfer from the CDC webpage(s) into a numbers spreadsheet having the following columns.
SHOW SPREADSHEET IN SEPARATE WINDOW ↬
Download the Numbers spreadsheet modDR.numbers.
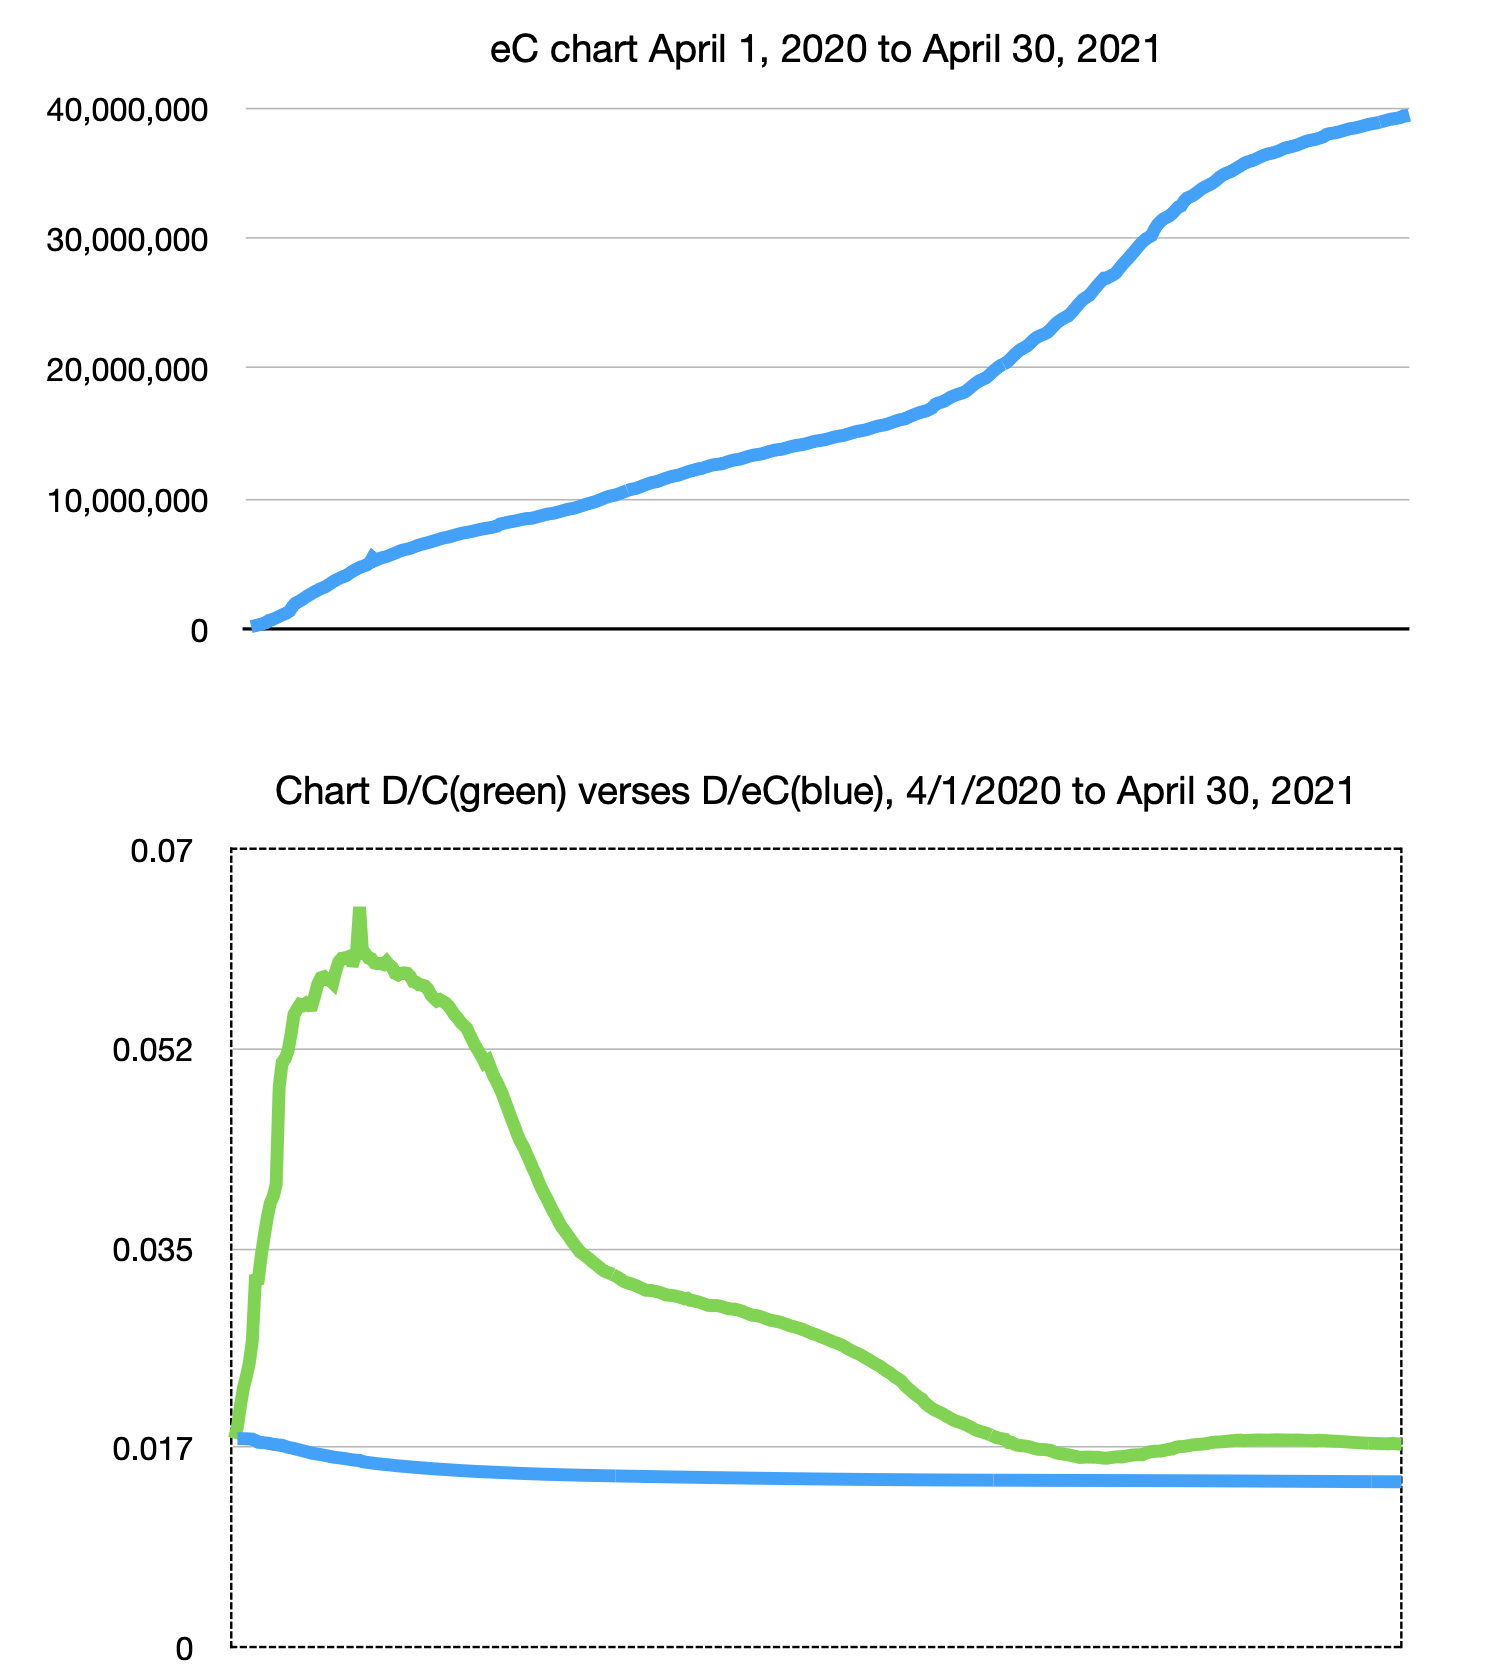
This is an "April Fools" modified regression: The confirmation of Deaths is an inherent dramatic stastistic and Cases is a more general fluent subject to various institutional "testing" policies. The eC calculculation resembles a "present/future value" (economic) calculculation.
For example, on May 20 the confirmed U.S. death rate Deaths/Cases = 6.0%. The estimated number of cases eC = 5,689,798 (vs. 1,528,235 "confirmed") and the corresponding modified death rate Deaths/eC = 1.61%.
PROJECT: Use reliable data sources to recalculate the fool's regression over current data collections (extended past 4/30/21) using various starting dates for death data.